Read Time:
18 Mins
Talent Acquisition ROI Measurement Framework for CFOs


Your TA team just closed a strong quarter. Fill rates are up. Time-to-fill is down. Candidate satisfaction scores look good. You walk into the budget review with confidence — and your CFO asks one question: "What's the return on what we spent?" The room goes quiet.
This is the defining problem for talent acquisition leaders at Indian mid-market and enterprise companies in 2026. The metrics TA teams track are real and meaningful — but they don't translate into the financial language that earns budget, headcount, and credibility. Building a talent acquisition ROI measurement framework that your CFO will actually believe isn't about adding more dashboards. It's about connecting hiring activity to business outcomes in rupees, dollars, and percentages that finance understands.
This guide walks you through seven concrete steps to build that framework — with specific guidance for companies running multi-agency or marketplace-based hiring models across India and international markets.
The gap between TA reporting and finance expectations isn't a personality conflict. It's a structural problem. Most TA teams report on operational metrics, time-to-fill, offer acceptance rate, pipeline volume. These measure how busy the function is. CFOs want to know how productive the investment was.
Think about it from the CFO's perspective. Every other business function, marketing, sales, product, is expected to show return on investment. Marketing tracks revenue attributed to campaigns. Sales tracks revenue per rep. But TA often presents activity data and calls it performance data. That's a credibility gap that costs TA teams budget every single year.
The second problem is that most TA metrics are disconnected from business outcomes. Filling a role in 28 days sounds good. But if the hire leaves in six months, or takes four months to reach full productivity, the 28-day fill time is irrelevant to the business. CFOs know this intuitively, even if they can't articulate it.
For Indian companies hiring across multiple geographies, whether that's building teams in Singapore, Germany, or the UAE, the problem compounds. Multi-agency models, fragmented invoicing, and inconsistent data across vendors make it nearly impossible to produce a clean ROI picture. The result: TA gets treated as a cost centre, not a value driver.
The fix is a structured talent acquisition ROI measurement framework that starts with financial inputs and ends with financial outputs. Here's how to build one.
Before you can calculate ROI, you need to know what you're actually spending. Most companies dramatically undercount their true cost of hiring because they only track the obvious line items, agency fees and job board subscriptions. The real number is much larger.
For companies running multi-agency models, there's an additional hidden cost: vendor management overhead. If your TA team is managing 15, 20 agencies across different geographies, the administrative time alone can consume 20-30% of their working hours. That's a cost that almost never appears in a cost-per-hire calculation, but it should. You can explore the full breakdown in our post on recruitment agency cost in India: what you're really paying.
Action step: Build a fully-loaded cost-per-hire (FLCPH) model that captures all direct and indirect costs. Divide total hiring spend (including internal time) by the number of hires made. This becomes your baseline ROI denominator.
Not all sourcing channels deliver equal value, and most TA teams don't have the data to prove which ones do. A sourcing channel ROI scorecard fixes this by tracking performance at the channel level, not just the aggregate.
For each sourcing channel (job boards, individual agencies, AI marketplaces, employee referrals, direct sourcing), track:
When you run this analysis, the results are often surprising. A job board that looks cheap on cost-per-application can be expensive on cost-per-hire because conversion rates are low. An agency that charges a higher fee can deliver better ROI if their hires stay longer and perform better.
For companies using multiple recruitment agencies, especially for international hiring, the scorecard becomes even more important. Without it, you're paying fees to agencies that deliver low-quality submissions while your best-performing vendors don't get enough briefs.
Marketplace-based hiring models, where a single platform routes roles to specialist agencies, make this analysis significantly easier. Instead of reconciling data from 15 separate agency portals, you get a unified view of submission quality, conversion rates, and cost-per-hire across your entire vendor network. This is one of the core advantages of platforms like CBREX, which consolidates multi-agency performance data into a single reporting layer.
For a deeper comparison of channel economics, see our analysis of hiring platforms in India: job boards vs. agencies vs. AI marketplaces.
Action step: Build a simple spreadsheet scorecard with one row per sourcing channel and columns for each metric above. Update it monthly. After three months, you'll have enough data to make defensible budget reallocation decisions.
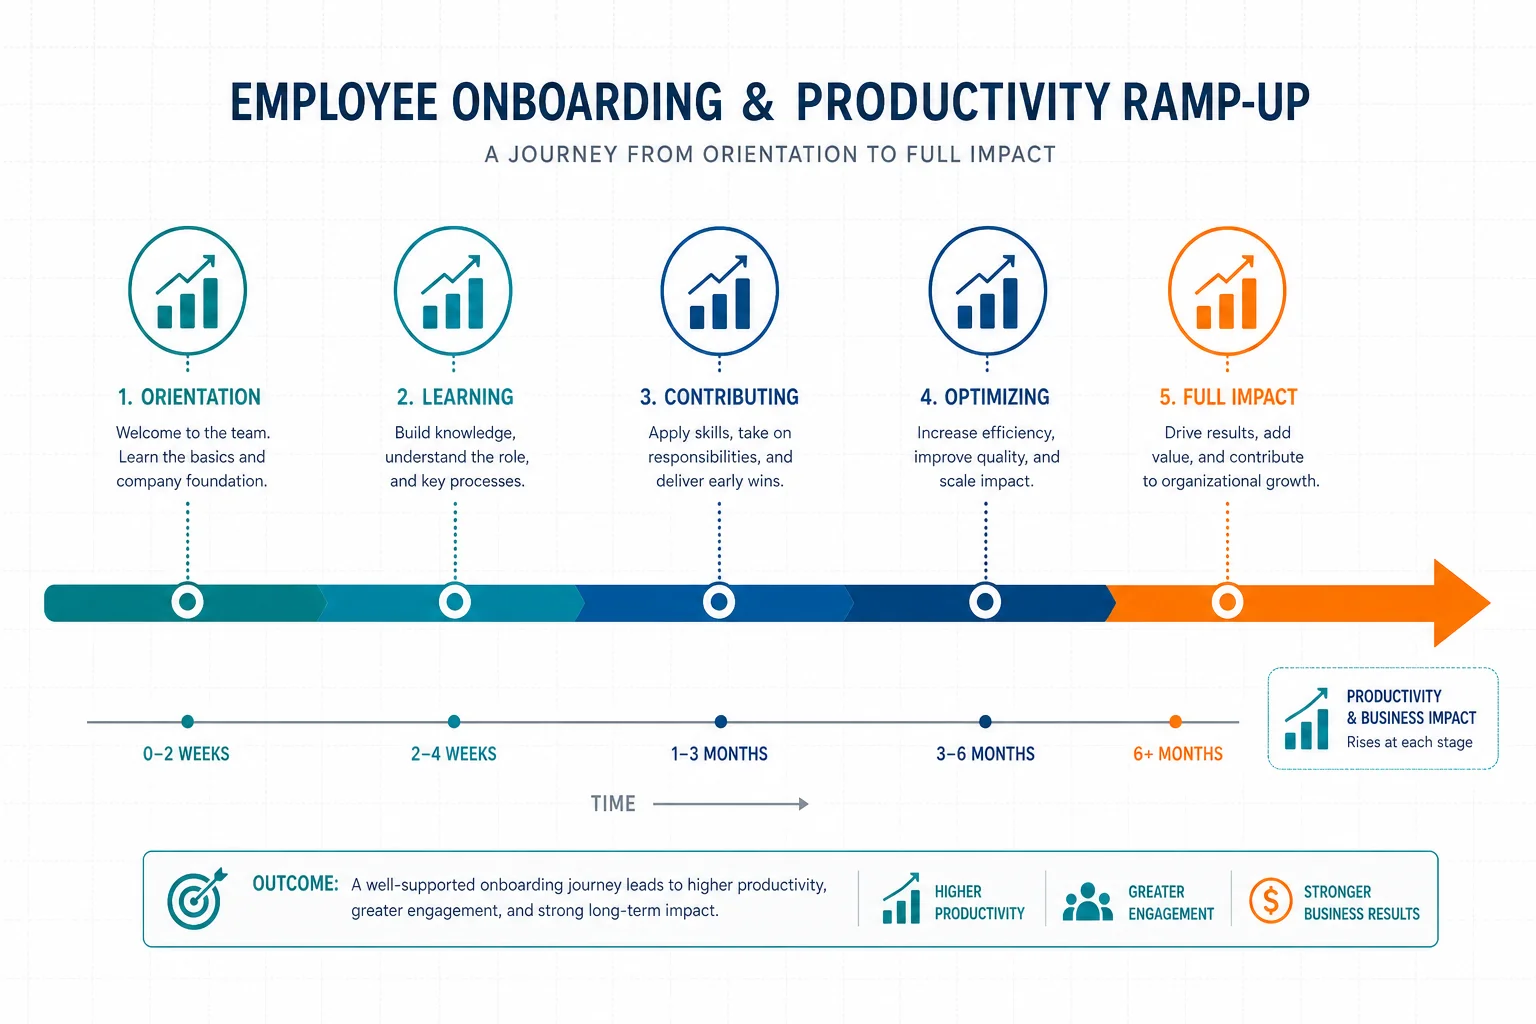
Time-to-fill is the metric TA teams love and CFOs ignore. It measures how fast you close a requisition, not how fast the business gets value from the hire. Time-to-productivity is the metric that actually matters to finance.
Time-to-productivity measures the number of days from a hire's start date to the point where they're operating at full expected output. For most roles, this breaks into three phases:
To translate this into financial terms, calculate the productivity gap cost: the difference between what the hire is producing and what a fully-ramped employee would produce, multiplied by the daily cost of the role (salary + benefits + overhead).
For a senior hire at ₹30 lakh CTC, a 90-day ramp period at 60% average productivity represents approximately ₹3.75 lakh in productivity gap cost, before you've even counted the cost of the open role while you were hiring.
Every day a role sits open, the business is losing value. For revenue-generating roles, this is straightforward: calculate the daily revenue contribution of a fully-productive employee in that role. For support and operational roles, estimate the cost of work not done, overtime paid to cover the gap, or contractor costs.
A mid-level sales role generating ₹1.5 crore in annual revenue has a daily vacancy cost of approximately ₹41,000. A 60-day time-to-fill costs the business ₹24.6 lakh in lost revenue opportunity, far more than the agency fee. This is the number your CFO needs to see. We've covered this calculation in detail in our post on the hidden cost of roles left open.
Action step: For your top 10 open roles, calculate the daily vacancy cost and the projected productivity gap cost. Present these numbers alongside time-to-fill in your next TA review. Watch the conversation change.
Quality-of-hire is the most important metric in any talent acquisition ROI measurement framework, and the hardest to measure. Most TA teams track it loosely, if at all. Here's how to make it concrete and financial.
A simple quality-of-hire score can be calculated as: (Performance Score + Retention Score + Ramp Speed Score) / 3. Each component is scored on a 0, 100 scale. A score above 80 represents a high-quality hire; below 60 signals a problem.
To make quality-of-hire meaningful to a CFO, you need to attach a rupee value. Here's a practical approach:
For companies using AI-powered screening tools, quality-of-hire scores tend to be higher because candidates are pre-validated before they reach the interview stage. Tools like CBREX's C Screen, trained on 250,000+ anonymised resumes across 570+ job categories, reduce the volume of low-quality submissions that inflate hiring costs and drag down quality-of-hire averages. See how AI screening affects these outcomes in our guide to choosing the right AI resume screening tool in 2026.
Action step: Set up a 90-day and 180-day check-in process with hiring managers for every new hire. Collect a simple performance rating (1, 5 scale) and whether the hire is on track. Feed this data back into your sourcing channel scorecard to identify which channels produce the highest quality-of-hire.
If you're running a multi-agency hiring model, which most Indian mid-market and enterprise companies do, vendor performance visibility is the foundation of ROI measurement. Without it, you're paying fees without knowing which vendors are actually delivering value.
Track these five metrics for every agency in your panel:
When you combine these five metrics into a vendor scorecard, you can rank your agencies by ROI contribution, not just by volume of submissions. The agency sending you 30 CVs a month may be delivering less ROI than the specialist firm sending you 5 highly targeted candidates.
Most Indian companies with multi-geo hiring needs have accumulated vendor sprawl over time: dozens of agencies across different geographies, each with separate contracts, fee structures, and invoicing cycles. This makes ROI measurement nearly impossible because the data is fragmented across too many systems.
Consolidating your vendor pool, either through a managed vendor model or a recruitment marketplace, is often the prerequisite for meaningful ROI measurement. When all vendor activity flows through a single platform, you get unified data, unified invoicing, and a clean basis for ROI calculation. Our guide on how to build a consolidated recruitment vendor pool covers the consolidation process in detail.
Action step: Pull your last 12 months of agency data and calculate submission-to-hire ratios for each vendor. Identify your top three and bottom three performers. Use this data to rebalance your brief distribution, more roles to high-performing agencies, fewer to low performers.
You now have the inputs. Here's how to assemble them into a financial statement that a CFO will find credible.
The fundamental formula for talent acquisition ROI is:
Talent Acquisition ROI = (Value of Hire − Total Cost of Hire) / Total Cost of Hire × 100
Where:
For a hire with a ₹20 lakh CTC, a quality-of-hire score of 85%, and a 10% first-year attrition probability, the value of hire is approximately ₹15.3 lakh. If the total cost of hire (including agency fee, internal time, and productivity gap) is ₹4 lakh, the ROI is 282%. That's a number a CFO can work with.
Your CFO doesn't want a 20-slide deck. They want a one-page summary with five numbers:
According to the Society for Human Resource Management (SHRM), the average cost-per-hire across industries is approximately $4,700 USD. For Indian companies hiring internationally, this number is often significantly higher due to agency fees, compliance costs, and longer search timelines. Benchmarking your numbers against SHRM data gives your CFO a credible external reference point.
Action step: Build a one-page TA ROI summary template and commit to presenting it at every quarterly business review. Consistency builds credibility, and credibility builds budget.
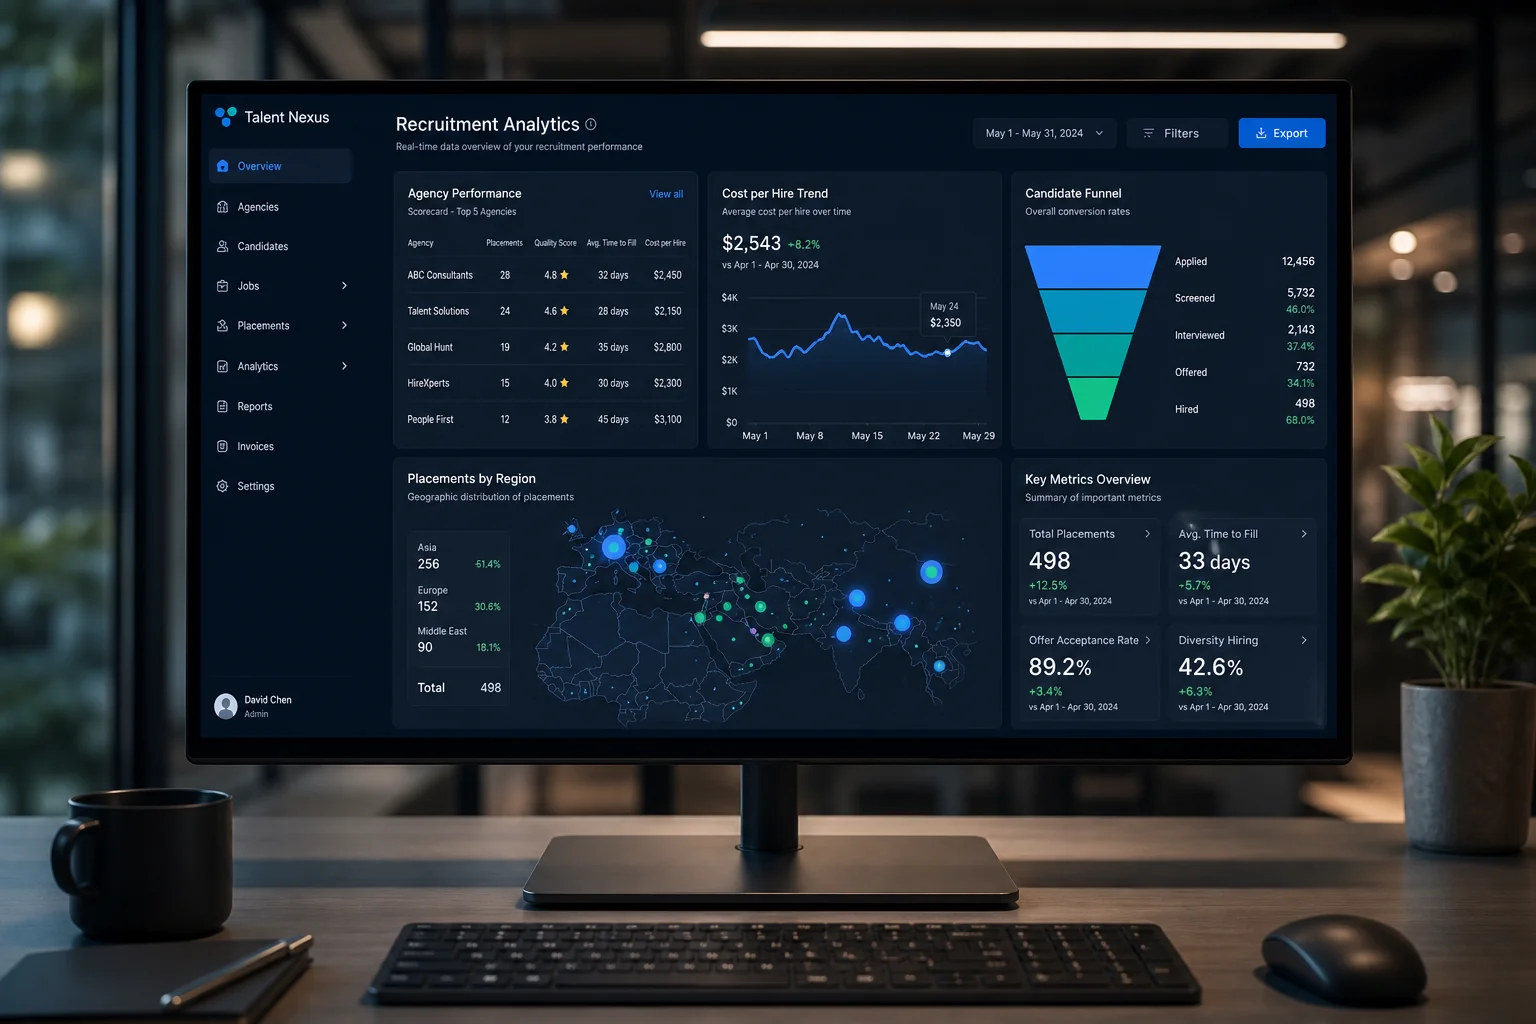
A talent acquisition ROI measurement framework is only as good as the data feeding it. Manual tracking works for a quarter or two, then it breaks down under the weight of scale, especially for companies hiring across multiple geographies.
Your ATS is the system of record for hiring activity. For ROI measurement to work, your ATS needs to capture:
Without clean ATS data, your ROI calculations will always be estimates. With clean data, they become defensible financial statements. The challenge for most Indian companies is that their ATS is not integrated with their agency management process, candidates arrive via email, WhatsApp, and separate portals, making source tracking nearly impossible.
This is where marketplace-based hiring models have a structural advantage over traditional multi-agency management. When all agency activity flows through a single platform, every submission, every stage progression, and every hire is automatically tracked and attributed to the correct source.
CBREX's platform, for example, integrates with all major ATS systems and provides a unified view of agency performance, candidate pipeline, and cost-per-hire across all geographies and all vendors, without requiring manual data entry from your TA team. For companies hiring across India, Southeast Asia, the Middle East, and Europe simultaneously, this kind of automated data consolidation is the difference between having an ROI framework and just having a spreadsheet.
For companies evaluating their RPO and outsourcing options as part of this process, our comparison of RPO vs. agency models for Indian mid-market companies is worth reading alongside this framework.
Measurement without review is just data collection. Build a formal quarterly cadence where TA presents ROI data to finance. The agenda should cover:
This cadence does two things. First, it forces TA to maintain data discipline throughout the quarter. Second, it positions TA as a strategic function that manages investments, not just a service function that fills seats.
According to LinkedIn's Global Talent Trends research, TA teams that present ROI data to finance are significantly more likely to receive budget increases than those that present operational metrics alone. The framework isn't just about measurement, it's about positioning.
Action step: Schedule your first quarterly TA ROI review within the next 30 days. Even if your data is incomplete, starting the cadence signals intent and builds the habit. Improve the data quality each quarter.
There's no universal benchmark, but most finance teams consider a talent acquisition ROI above 200% (meaning the value delivered by hires is at least 3x the cost of hiring them) to be strong. For senior and specialist roles, ROI can be significantly higher because the value contribution of a high-performing hire is large relative to the hiring cost. The key is to calculate your current ROI first, then set improvement targets quarter-over-quarter.
Quality-of-hire is best measured as a composite of three factors: performance rating at 90 and 180 days (collected from hiring managers), retention at 12 months, and ramp speed (time to reach full productivity). Each factor is scored on a 0, 100 scale and averaged. A score above 80 represents a high-quality hire. Tracking quality-of-hire by sourcing channel and agency allows you to identify which sources consistently deliver the best hires.
International hiring adds complexity because costs vary significantly by geography (agency fees, compliance costs, relocation) and because time-to-productivity may be longer for cross-border hires. Indian companies with multi-geo hiring needs should calculate ROI separately by geography and role type, then aggregate to a total. Using a single-platform model for international hiring, rather than managing separate agency relationships in each country, makes this data consolidation significantly easier.
CFOs respond best to five metrics: fully-loaded cost-per-hire, total hiring investment vs. budget, average time-to-productivity (in days and rupee cost), quality-of-hire score with projected retention rate, and calculated ROI (value of hires vs. cost of hiring). Avoid presenting operational metrics like time-to-fill or offer acceptance rate in isolation, always connect them to a financial outcome.
Yes, consistently. Vendor consolidation reduces administrative overhead (which lowers indirect hiring costs), improves data quality (which enables better ROI measurement), and allows TA teams to concentrate briefs with high-performing agencies (which improves quality-of-hire). Companies that consolidate from 20+ agencies to a managed vendor pool typically see cost-per-hire reductions of 15-25% within the first year, primarily through reduced management overhead and improved agency performance. See our detailed guide on vendor consolidation in recruitment for more.
The talent acquisition ROI measurement framework outlined here isn't theoretical. Every step, from fully-loaded cost-per-hire to vendor performance dashboards to CFO-ready ROI statements, is implementable with the data most TA teams already have access to. The gap isn't data. It's structure.
For Indian mid-market and enterprise companies hiring across multiple geographies, the framework becomes even more powerful when it's backed by a platform that centralises multi-agency data automatically. When you're not spending 30% of your TA team's time on vendor administration, you have the bandwidth to actually measure, analyse, and improve your hiring ROI.
If you're ready to see what a unified talent acquisition ROI measurement framework looks like in practice, with real data from your own hiring activity, book a demo with CBREX and we'll walk you through how the platform consolidates your multi-agency performance data into a single, CFO-ready view. Or if you'd prefer to explore the platform first, sign up and get started, no retainers, no upfront fees, no commitment until you make a hire.
Have specific questions about building your ROI framework for international or multi-geo hiring? Let's talk, our team works with TA leaders across India and globally to build measurement systems that actually hold up in a CFO review.


